Description
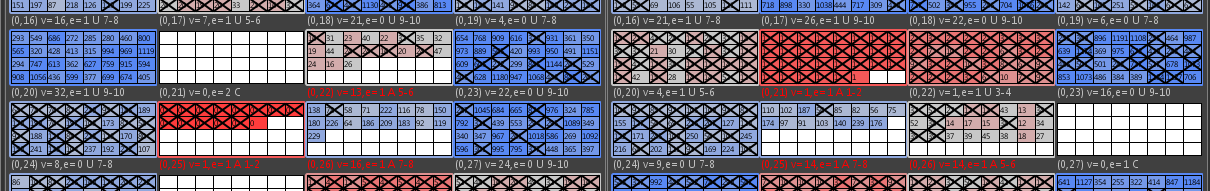
This video demonstrates the benefit from “zooming out” and visualizing aggregate attributes and statistics. Here, we view a device of 32K pages where each block is colored according to the average temperature of its pages. When the simulation ends we switch the view, so that blocks are colored according to the number of times they have been erased, demonstrating the uneven wear due to the skewed workload.